
On this page is a household income percentile calculator for the United States in 2026. Enter pre-tax (gross) household income between January and December 2025 to compare to household income percentiles in the full year.
Afterwards, visit the income percentile by state and income percentile by city calculator. Or, try the individual income calculator.
Find the methodology in the United States average income, median income, and income percentile post.
Household income percentile statistics in 2026
Below, see what the household income brackets looked like for the average, 10th, 25th, 50th, 75th, 90th, and 99th (the top 1%) percentiles in 2026 vs. 2025:
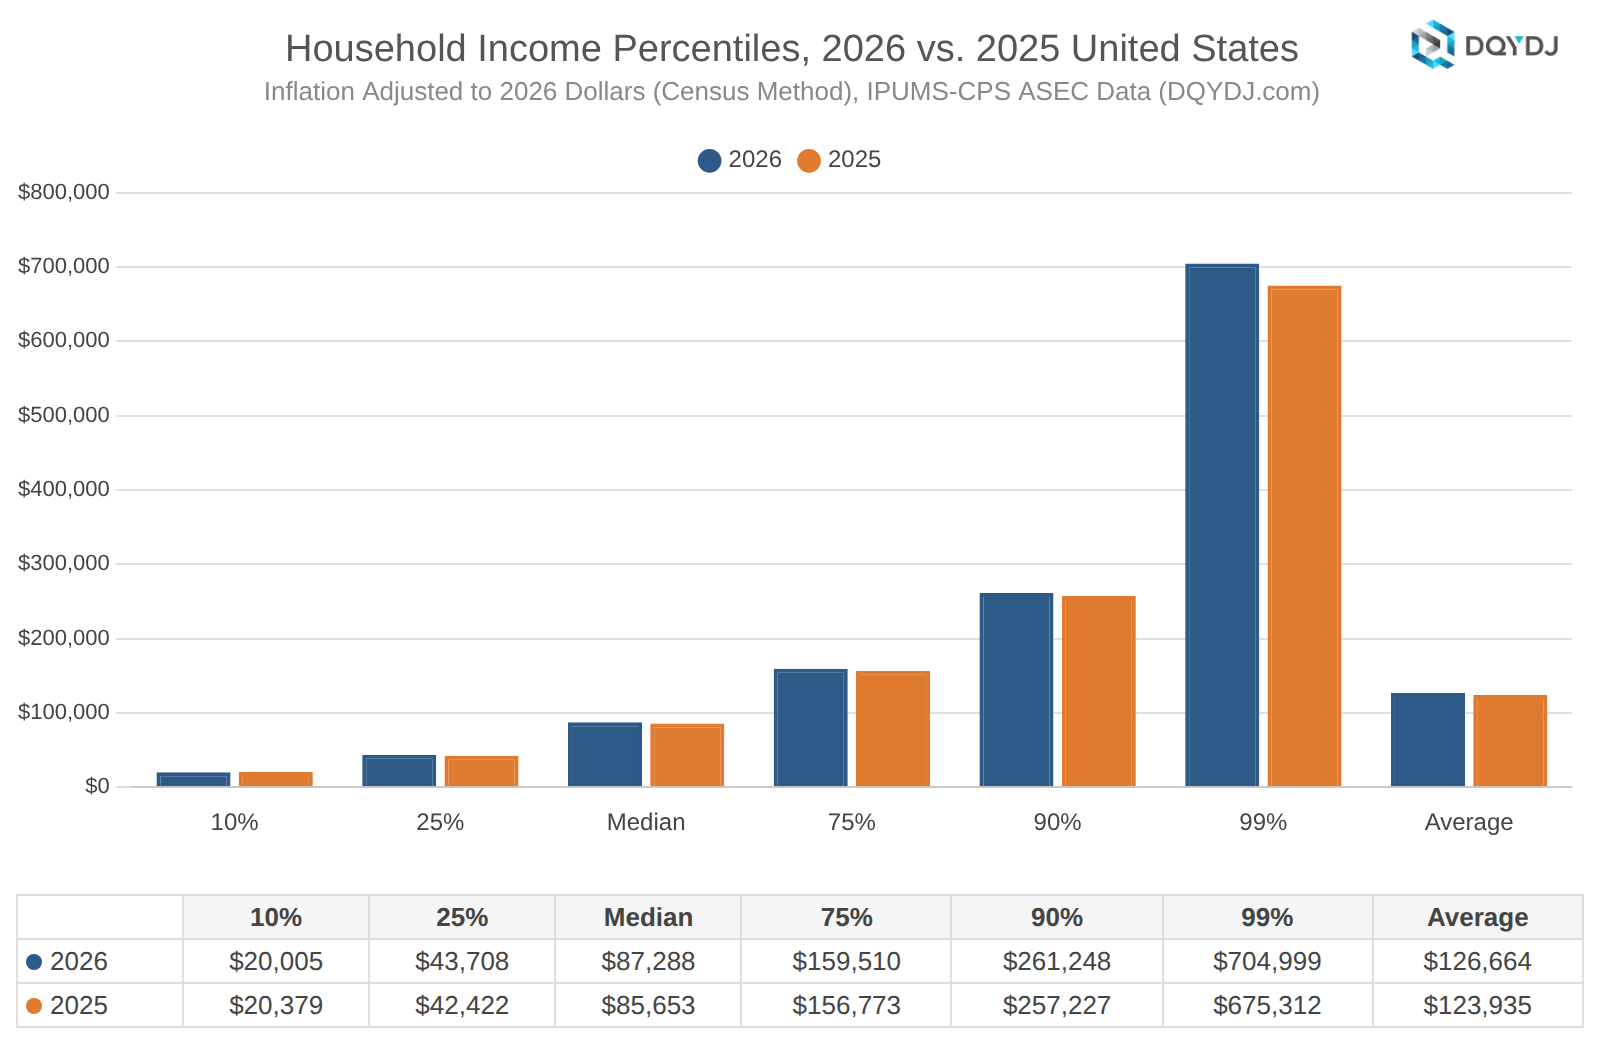
(2025 numbers are adjusted for inflation with the Census Bureau's method. Inflation was 2.47% year over year.)
Mostly across the board, household income percentiles were higher (even adjusted for inflation!) in 2026 versus 2025. My household income by year post lets you compare versus other years, and the above linked household income methodology and brackets post has more details on the brackets.
What was the United States average household income?
In 2026, average household income in the United States was $126,664.22.
What was the United States median household income?
In 2026, median household income in the United States was $87,288.
How many US households made $100,000 or more in 2026?
In 2026, 44.7% of households, or around 61,338,098 households, made a six-figure income.
How many US households made $250,000 or more in 2026?
About 15,049,950 households or 11.0% of all US households made $250,000 or more in 2026, up from 10.1% in 2025.
How many US households made $500,000 or more in 2026?
About 3,061,606 households, or 2.2% of all US households, made $500,000 or more in 2026.
How many US households made $1,000,000 or more in 2026?
About 798,507 households, or 0.6% of all US households, made $1,000,000 or more in 2026.
What was the top 10% household income percentile in 2026?
The threshold to be in the top 10% of household incomes in 2026 in the United States was $261,248.
What was the top 5% household income percentile in 2026?
The threshold to be in the top 5% of household incomes in 2026 in the United States was $354,000.
What is the top one percent household income in the US in 2026?
In 2026, the threshold for a household to be top 1% was $704,999 in earnings.
See our one percent in America article for more. Net worth is a better take on the one percent, although often one-percenter refers to income.
What other calculators do you have?
Thanks for being a reader! Want more calculators and interactive tools?
See our individual income by age calculator and individual income calculator. Also see our net worth calculator and net worth by age calculator.
Alternatively, see everything on our calculator roundup page.
Source and methodology on the 2026 household income percentile calculator
Sarah Flood, Miriam King, Renae Rodgers, Steven Ruggles, J. Robert Warren, Daniel Backman, Etienne Breton, Grace Cooper, Julia A. Rivera Drew, Stephanie Richards, David Van Riper, and Kari C.W. Williams. IPUMS CPS: Version 13.0 [dataset]. Minneapolis, MN: IPUMS, 2025. https://doi.org/10.18128/D030.V13.0
See the household income bracket article for details on methodology – but household is easier to screen for than individual income.
Want to see past years? Our household income by year post or household income percentile growth comparison tool aggregate the data. Or, here are the archived household income calculators:
- 2025 US Household Income Calculator
- 2024 US Household Income Calculator
- 2023 US Household Income Calculator
- 2022 US Household Income Calculator
- 2021 US Household Income Calculator
- 2020 US Household Income Calculator
- 2019 US Household Income Calculator
- 2018 US Household Income Calculator
- 2017 US Household Income Calculator
- 2016 US Household Income Calculator
Also, we have a household income by year post. Try that one first (it does inflation adjustments for you).
