
Below is an individual income percentile calculator for the United States in 2026. Enter pre-tax, gross income earned in full-year 2025 – January to December – to compare to the US individual income distribution. You can select to compare versus all workers, or all workers who usually worked 30+ or 40+ hours a week for at least 40 weeks.
(Math and methodology can be found in our average, median, and top 1% individual income post)
Afterward, try our income percentile by state and income percentile by city calculators. Or, switch to the household income calculator.
Individual income percentiles for the US income distribution in 2026
In this graph, I'm comparing single-person earnings between 2026 and 2025.
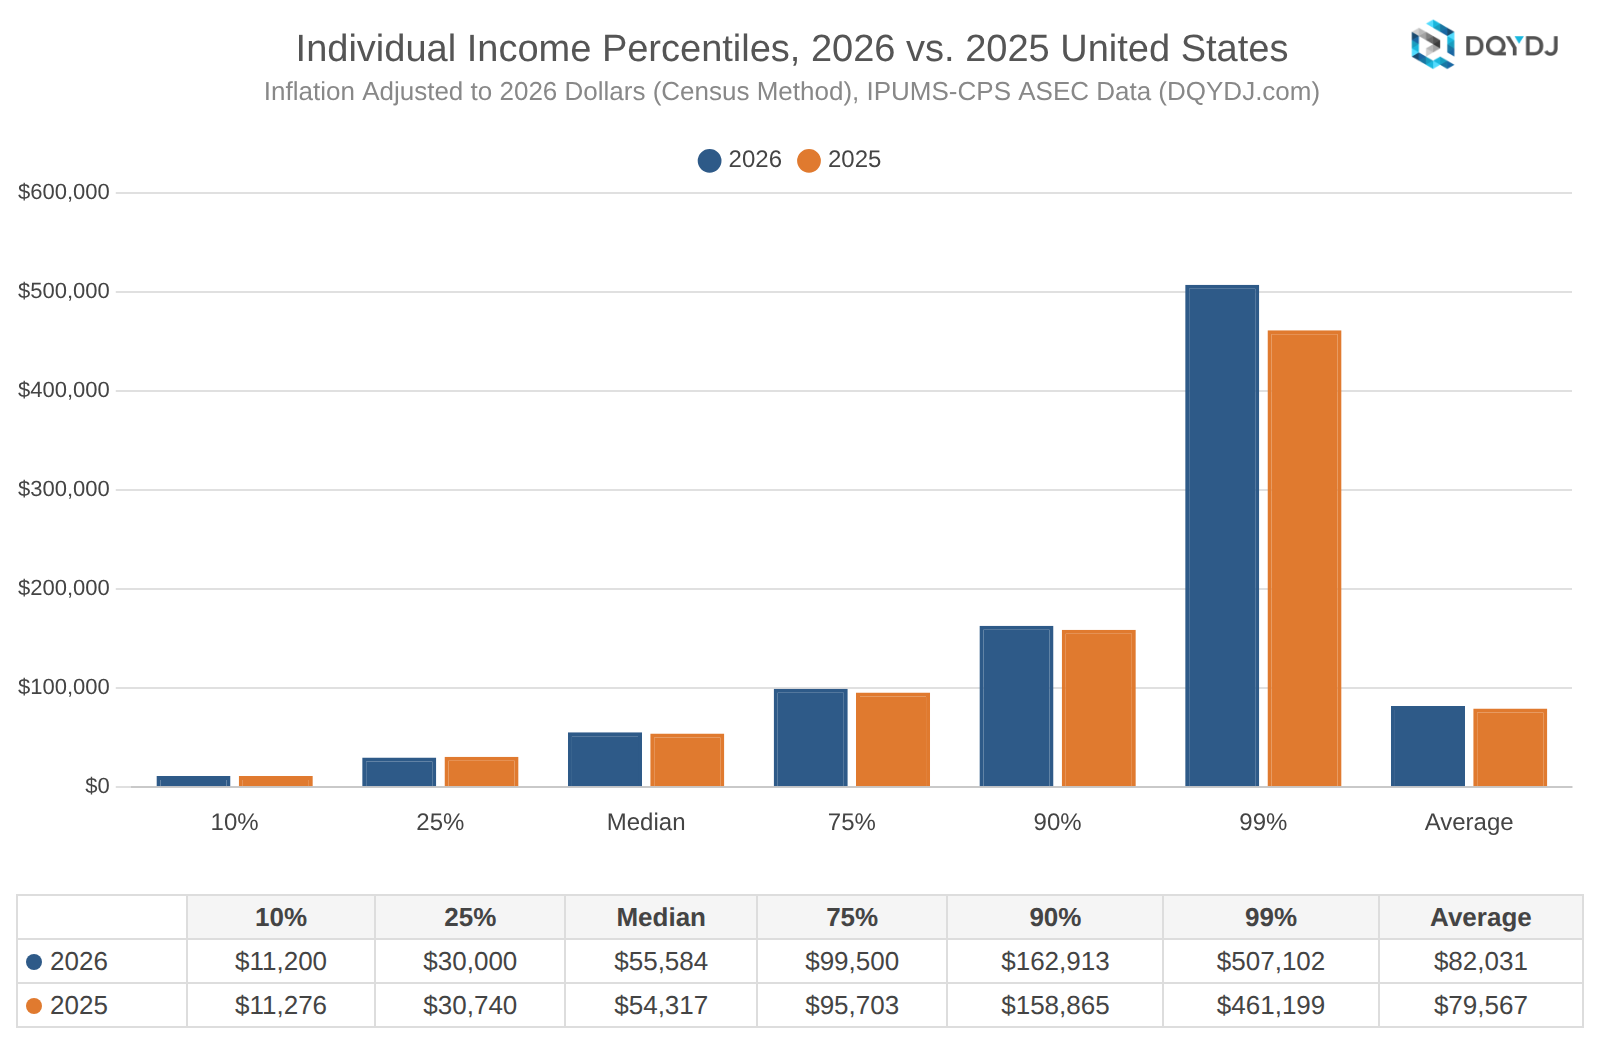
(2025 numbers are adjusted for inflation with the Census Bureau's method.)
What was the median individual income in 2026?
In the United States, median individual income was $55,584 in 2026.
What was the average individual income in 2026?
In the United States, average individual income was $82,030.90 in 2026.
What was the top 1% individual income in 2026?
The United States threshold for a top 1% individual earner was $507,102 in 2026.
In 2026, what was the threshold for the top 10% individual income in the United States?
The top 10% of individual earnings started at $162,913 in the United States in 2026.
In 2026, what was the threshold for the top 5% individual income in the United States?
The top 5% of individual earnings started at $225,901 in the United States in 2026.
How many people made $50,000 or more in 2026?
104,330,237 workers – 57.1% of the workforce – made $50,000 or more, up from 54.6% in 2025.
How many people made $100,000 or more in 2026?
45,534,850 workers, or 24.9% of all individual workers, made a six-figure income.
How many people made $250,000 or more in 2026?
7,559,596 workers, or 4.13% of the workforce, made a quarter million or more in income.
How many people made $500,000 or more in 2026?
1.1% of workers, around 1,985,899 people, made a half million or more in income.
How many people made $1,000,000 or more in 2026?
Somewhere around 678,212 people made a seven-figure income in 2026. That's around 0.37% of the workforce.
(Talking about millionaires is usually more appropriate for net worth.)
What is considered a good individual income?
A good income in the United States started around $71,100 in 2026. That's the median individual income for a person who usually worked 40 or more hours a week for at least 40 weeks.
A high income is $115,795, the 75th percentile of earnings for 40+ hour workers. If you prefer to only look at salary – see the salary percentile calculator here.
These numbers are location dependent. In most of the country, they would provide you with a very good income. See our income by city post as income ranges vary widely by geography. (We also have income by state.)
Source and methodology on the 2026 individual income percentile calculator
Sarah Flood, Miriam King, Renae Rodgers, Steven Ruggles, J. Robert Warren, Daniel Backman, Etienne Breton, Grace Cooper, Julia A. Rivera Drew, Stephanie Richards, David Van Riper, and Kari C.W. Williams. IPUMS CPS: Version 13.0 [dataset]. Minneapolis, MN: IPUMS, 2025. https://doi.org/10.18128/D030.V13.0
For methodology, see the individual income bracket post. The only additional screens in this calculator are for workers who usually worked 30+ or 40+ hours a week – choose which one you like better for "full-time".
Want to see changes over time? See our income percentile by year tool or income percentile growth tool.
Or, try our calculators from years past:
- 2025 US Individual Income Calculator
- 2024 US Individual Income Calculator
- 2023 US Individual Income Calculator
- 2022 US Individual Income Calculator
- 2021 US Individual Income Calculator
- 2020 US Individual Income Calculator
- 2019 US Individual Income Calculator
- 2018 US Individual Income Calculator
- 2017 US Individual Income Calculator
- 2016 US Individual Income Calculator
- 2015 US Individual Income Calculator
- 2014 US Individual Income Calculator
